PELLEX REPORTS
Let Your Data Tell the Story
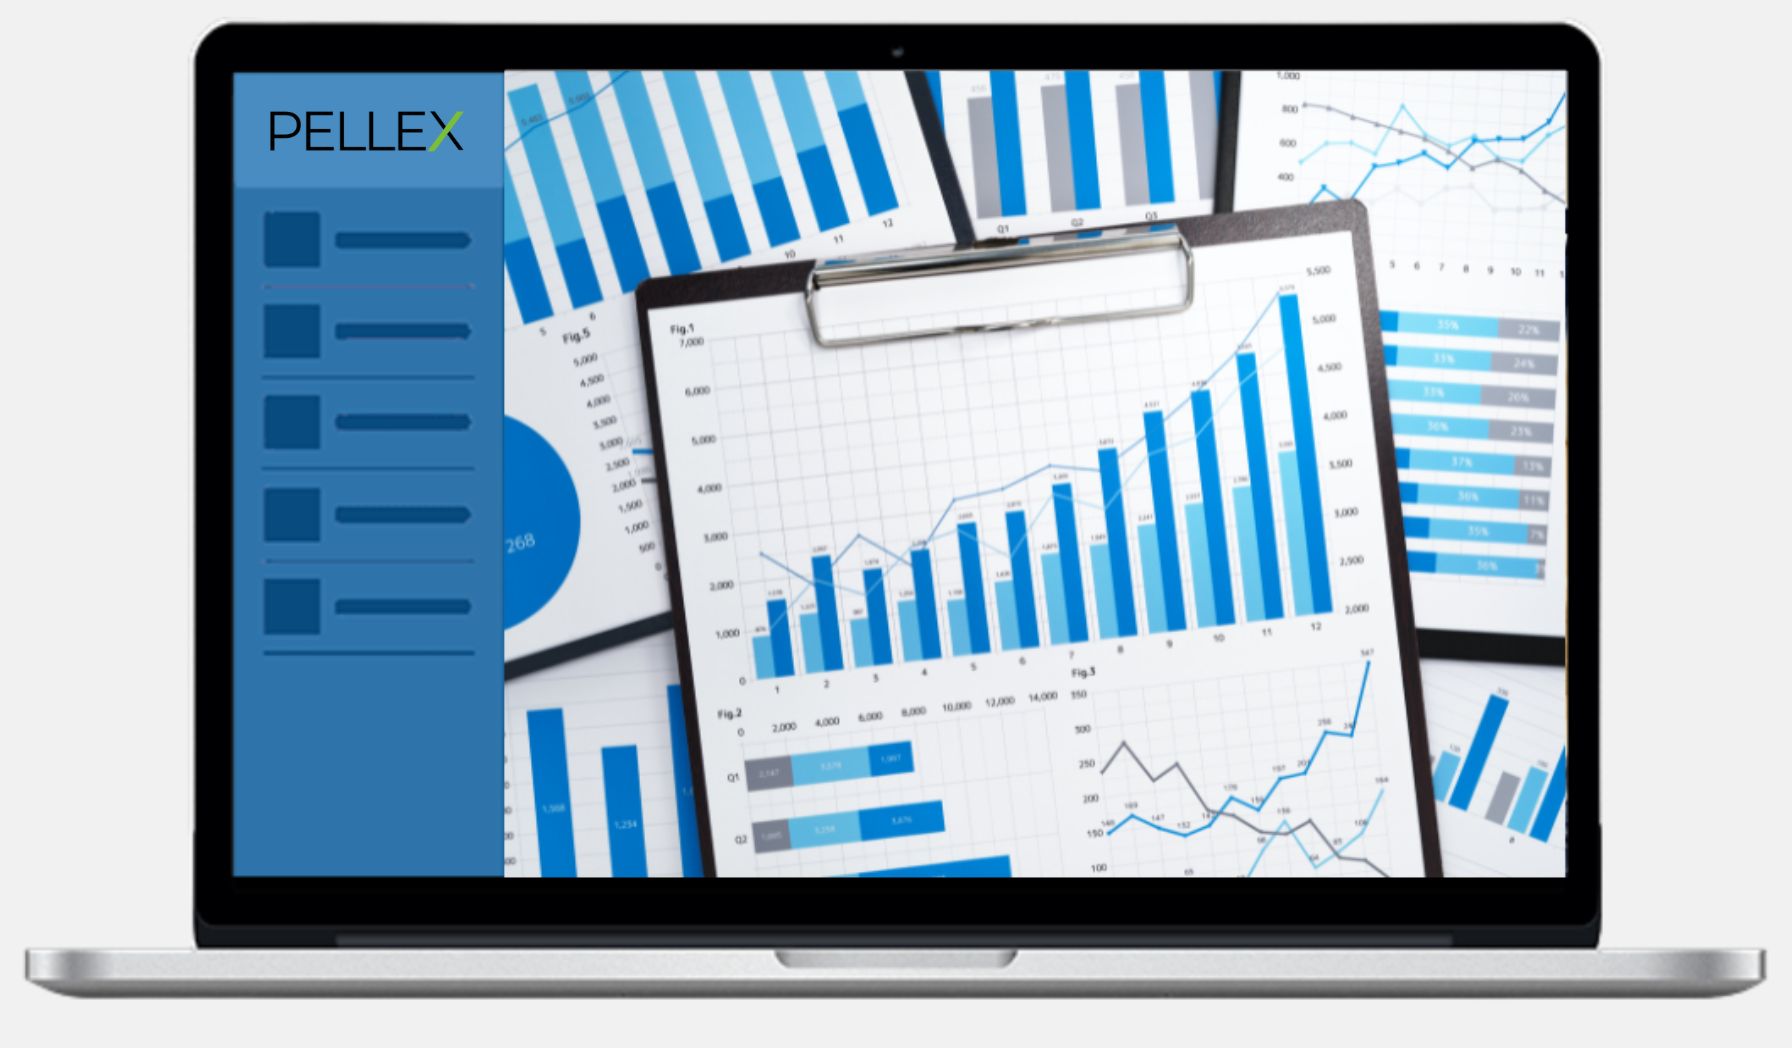
Compile all your business data into a single report. Select which data points to include and how they should display.

Never Miss an Insight. Capture Every Detail With PELLEX's Dashboard Report Builder:
Generate Reports for Yourself and Clients
Easily select the data—from different departments, categories, dashboards, and more—you want to see in a report. Instantly see what a report looks like so you can make adjustments as you go. View and update your reports at any time.
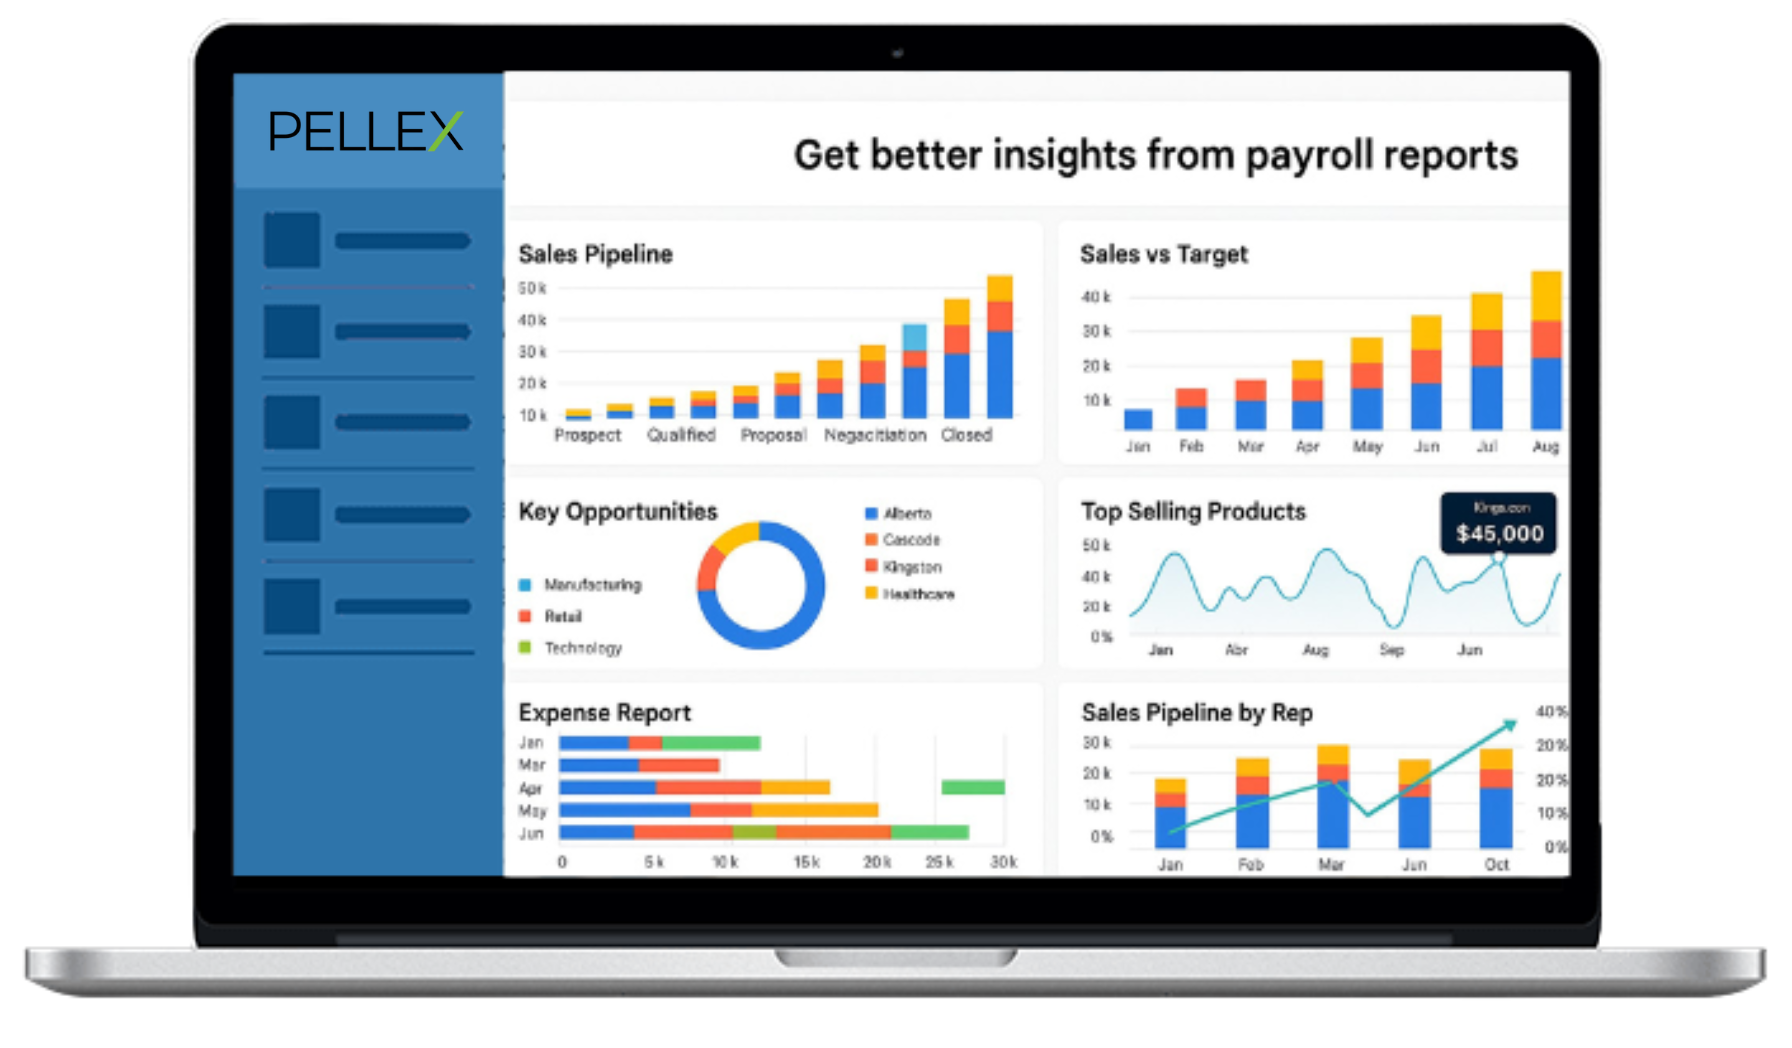
Gain Insights From All Data Sources Across Your Business
PELLEX is an all-in-one business tool. When you run your business on PELLEX, it’s easy to automatically pull data from every side of your business into a single holistic report. See the whole picture with PELLEX Reports.
Automate Regular Reporting
Create one-off reports or recurring ones. Receive regular updates about how your business is growing and changing.
Easily Share Reports
There are many ways to share PELLEX reports with others: save, print, download, email, and even create a designated link. However you choose to share your insights, PELLEX makes it easy.
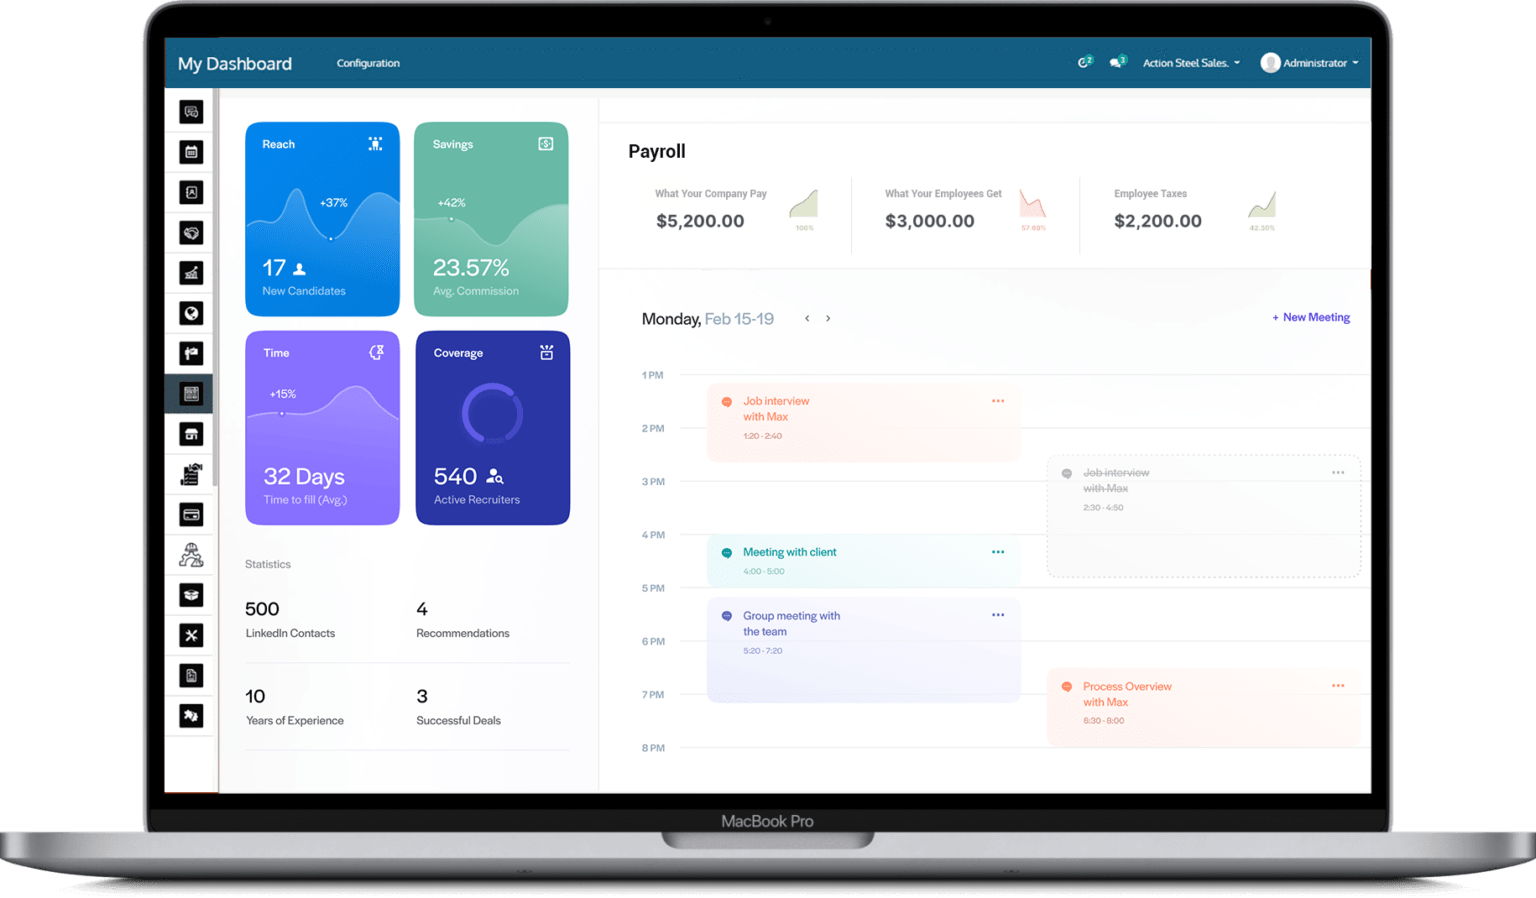
Create Your Own Dashboards
Generate unlimited dashboards. View your business—and the businesses of your clients—from every angle. Use PELLEX’s dashboard report builder today to gain new insights or show off the latest results.
Time to Show Off Your Numbers in Style
- Generate professional reports
- Easily view reports on mobile or desktop
- Choose when and how your receive automated reports
- Highlight the most important aspects of your business or latest campaign
- Start from a template or from scratch
- Select and deselect data points to change what shows up in each report
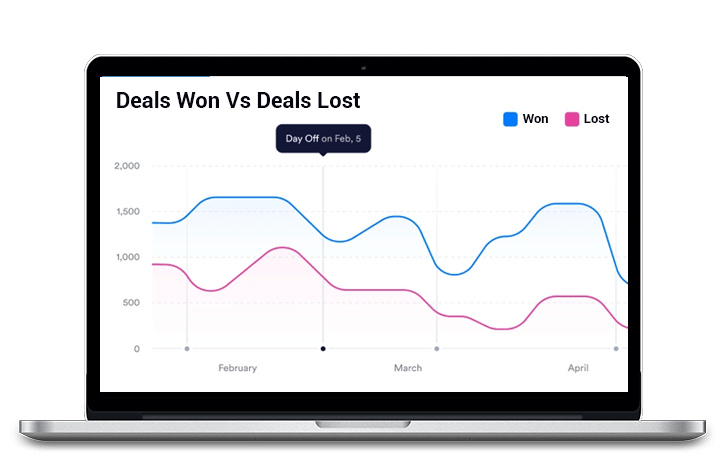
- Use multiple graph styles to present information from multiple angles,
Reporting and Analytics FAQs
PELLEX REPORTS helps you turn raw data—from sales, inventory, orders, and finance—into actionable insights through customizable reports and dashboards.
Absolutely. Pull data from across all modules—sales, payroll, inventory, CRM—and view it in a single, unified report.
Use filters and custom fields to break down sales by resin (e.g., HDPE, LDPE), customer segment, order size, or location.
Yes. Visualize how fast each product moves across regions, identify slow movers, and improve stocking strategies.
Easily. Create dashboards by sales team, territory, or client category to evaluate performance and prioritize high-value leads.
Schedule daily, weekly, or monthly reports on inventory, receivables, or operational KPIs and receive them straight to your inbox.
Yes. Share via secure links, email, PDF downloads, or export in multiple formats for internal or external use.
Yes. Start with ready-to-use templates for P&L, inventory valuation, sales velocity, and more—or build your own from scratch.
Yes. Use custom fields and filters to slice data by technical specs or custom classifications relevant to your products.
Use charts, graphs, and tables to visualize complex data, compare trends over time, and instantly spot bottlenecks or growth areas.
Yes. Create unlimited dashboards and restrict access to each team so they only see relevant data.
Yes. Connect with PELLEX BOOKS to calculate and display real-time margin per item, order, or customer.
Monitor receivables with aging reports, customer-level balances, and payment status filters.
Yes. View freight costs per order, shipping zone, or SKU and analyze their impact on overall profitability.
Yes. All dashboards are responsive—access reports on your phone or tablet from anywhere.
Only users with appropriate permissions can view or edit reports. Public links can be password-protected or revoked at any time.
Yes. Integrate CRM and SHOP data to view open rates, conversions, and ROI from targeted campaigns.
Monitor inbound/outbound transactions, stock discrepancies, order fulfillment rates, and backorder trends in real-time.
Absolutely. PELLEX REPORTS supports historical analysis with flexible date range filtering and visualization.
In minutes. Select data points, choose a layout, and hit publish. No coding or technical setup required.
Let Us Help You Understand Better.
We will send you a Product Brochure and Customer Feedback Video.
10 Navy Wharf Court,
Toronto, ON - M5V3V2
Canada